Distributed Publishing of Interactive Maps on Demand
Summary
The project aims are:
- get different map layers from different servers
- combine different map layers (match these layers)
- preparation of available data for analysis and interaction
- solution of graphical conflicts between map layers
- media independent presentation of the map
- platform independency
- possibility of personalized map (data search for use, area of interest, scale; import of new objects in the map, storage of user profiles)
- possibility of interactivity and analysis
The project is organized in five modules dealing with the following topics
- Design of a data model
- Design of the system architecture
- Distributed Mapping
- Map generalization in an interactive environment
- Cartographic symbolization
Software developments focus on an open extensible system built-up from reusable components (modules). The prototype software is currently used in a EU project on a Statistical Atlas of the European Union (STATLAS). Substantial work has been done on the design of the data model and the system architecture. The mainly technical aspects of distributed mapping have been addressed. A flexible method towards a more versatile and universal cartographic symbolization has been developped and will further be refined and promissing experiments concerning some aspects of map generalization have started. More specifically, progress has been achieved in:
- hierarchical and topological data model
- map projection for vector and raster data
- development of a flexible cartographic symbolization
- handling of multi-dimensional statistical data
- access of distributed data and data base systems
- operation in client and server environments
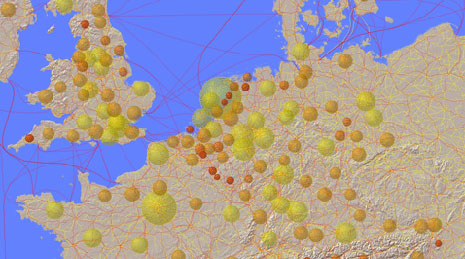
In the field of the cartographic symbolization the current work focuses on point-based symbols and diagrams and cartographic line drawing. Point-based symbols and diagrams can be created with primitives. These primitives are arranged via arrangement principles. Different graphical and constructive properties could be found to connect thematic data with these created symbols and diagrams.
Current graphic engines provide only limited line style capabilities, so that in final maps, inappropriate cartographic line symbolization often occurs. The new line drawing methods are to be developed and the capabilities of texture mapping approach for line symbolization are to be explored.
One PhD contributes to the project by examining thematic navigation in space and time. First, a general task taxonomy for spatio-temporal questions was compiled. Second, a in depth task analysis for navigation in space, time and topic is currently performed. Finally, the interdependencies between spatial, temporal and thematic navigation are studied. In parallel to the theoretic work, the development of a prototype for an interactive european map of cultural heritage is ongoing. The prototype features a map view, a timeline view, a hierarchic topic tree and network diagrams. Navigation tools are provided for each of the views.
Project period
01.01.2002 – 22.03.2010
Researchers
Lead: Hurni, Lorenz
Internal: Bär, Hans-Rudolf, He, Fei. Neumann, Andreas. Schnabel, Olaf.
Funding sources
ETH internal grant
EU
Own resources of the professorship
Partner
---
Web
---
Publications
Flüeler, Isabella; Iosifescu Enescu, Ionuț; Neumann, Andreas; Hurni, Lorenz. Cartographic SVG applications as risk management support and communication platforms. Workshop Visualization, Analytics & Spatial Decision Support at the GIScience 2006 conference, Münster, Germany. 13p., 2006.
He, Fei. Novel drawing algorithms and application of texture mapping for 2D cartographic line symbolization. Disseration, ETH Zürich. 167p., 2008.
Isakowski, Yvonne; Neumann, Andreas. Interactive Topographic Web-Maps using SVG. SVG Open / carto.net 2002 Developers Conference: Conference Proceedings (on CD-ROM)
Neumann, Andreas. Delivering Interactive Topographic Web-maps using Open-Source Database Technology. Proceedings of the 2nd SVGopen Conference, Vancouver, Canada. 2003.
Neumann, Andreas. Thematic Navigation in Space and Time – Interdependencies of Spatial, Temporal and Thematic Navigation for Cartographic Visualization - By Example of a European Map of Cultural Heritage. Proceedings svg.open 2005, Enscede, The Netherlands. 2005.
Neumann, Andreas. Use of SVG and ECMAScript Technology for E-Learning Purposes. International archives of photogrammetry, remote sensing and spatial information sciences, Volume 36, Issue 6. Berlin, Germany. 2005.
Neumann, Andreas. Using SVG for Online Digitizing and Editing of Geographic Data. Proceedings, SVG Open 2004. Tokyo, Japan. 2004.
Neumann, Andreas. Entwicklungsstand und Anwendungsmöglichkeiten von SVG im Webmapping. Webmapping.02, Conference Proceedings. Karlsruhe, Deutschland. 2002.
Neumann, Andreas. Navigation in space, time and topic. Sociedad Española de Cartografìa, International Cartographic Association ICA. A Coruña, Spain. 2005.
Schnabel, Olaf. Map Symbol Brewer. Proceedings, SVG Open 2004. Tokyo, Japan. 2004.
Schnabel, Olaf. Die Zukunft der Mobil- und Internetkartographie. Kartographische Nachrichten, Kirschbaum Verlag. Bonn, Deutschland. 2006.
Schnabel, Olaf. Map symbol brewer – A new approach for a cartographic map symbol generator. Sociedad Española de Cartografìa, International Cartographic Association ICA. A Coruña, Spain. 2005.
Williams, Juliana and Andreas Neumann. Interactive Hiking Map of Yosemite National Park. Proceedings of the fifth Mountain-Cartography Workshop, Bohinj, Slovenia. 2006.